Charts
New Trials
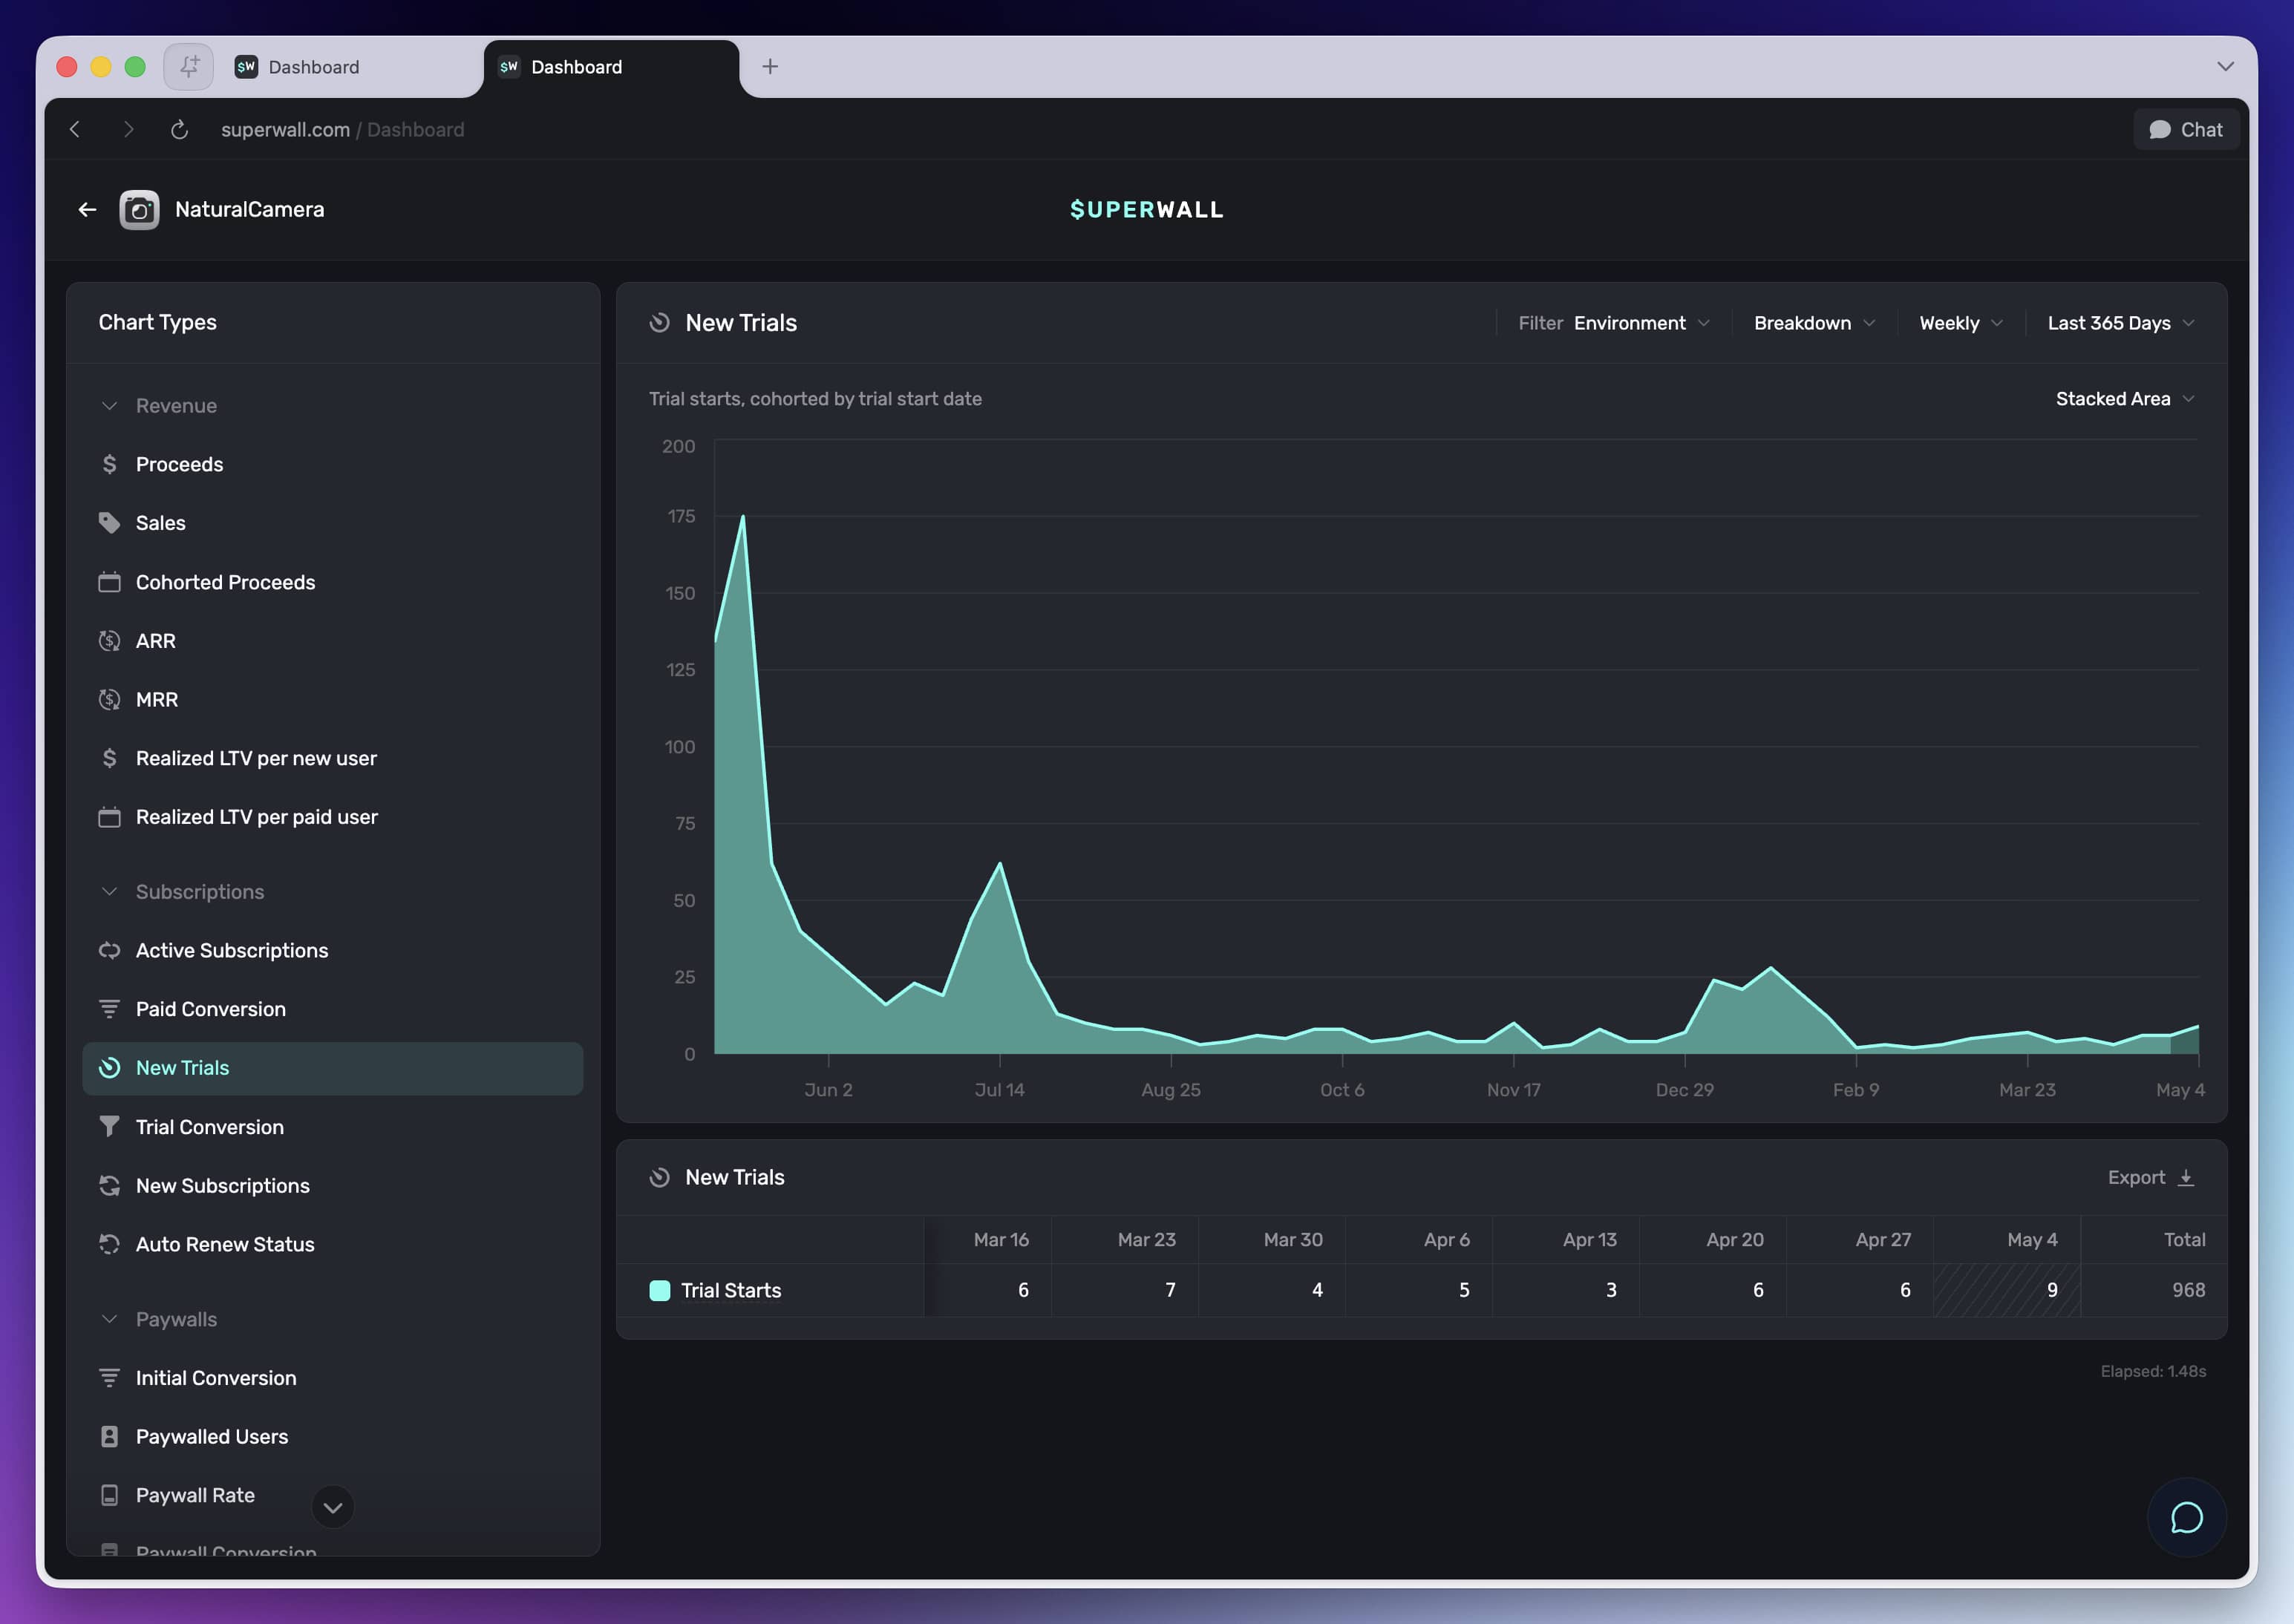
Learn what the New Trials chart measures and when to use it.
What it shows
New Trials shows trial starts, grouped by trial start date.
How to use it
Use this chart to understand how often users are entering trials. It is especially helpful after changing offers, pricing, trial eligibility, or paywall presentation.
Good to know
Trial volume is only one side of the story. Review Trial Conversion to see whether those trials are turning into paid subscriptions.
How is this guide?