Charts
New Users
Learn what the New Users chart measures and when to use it.
What it shows
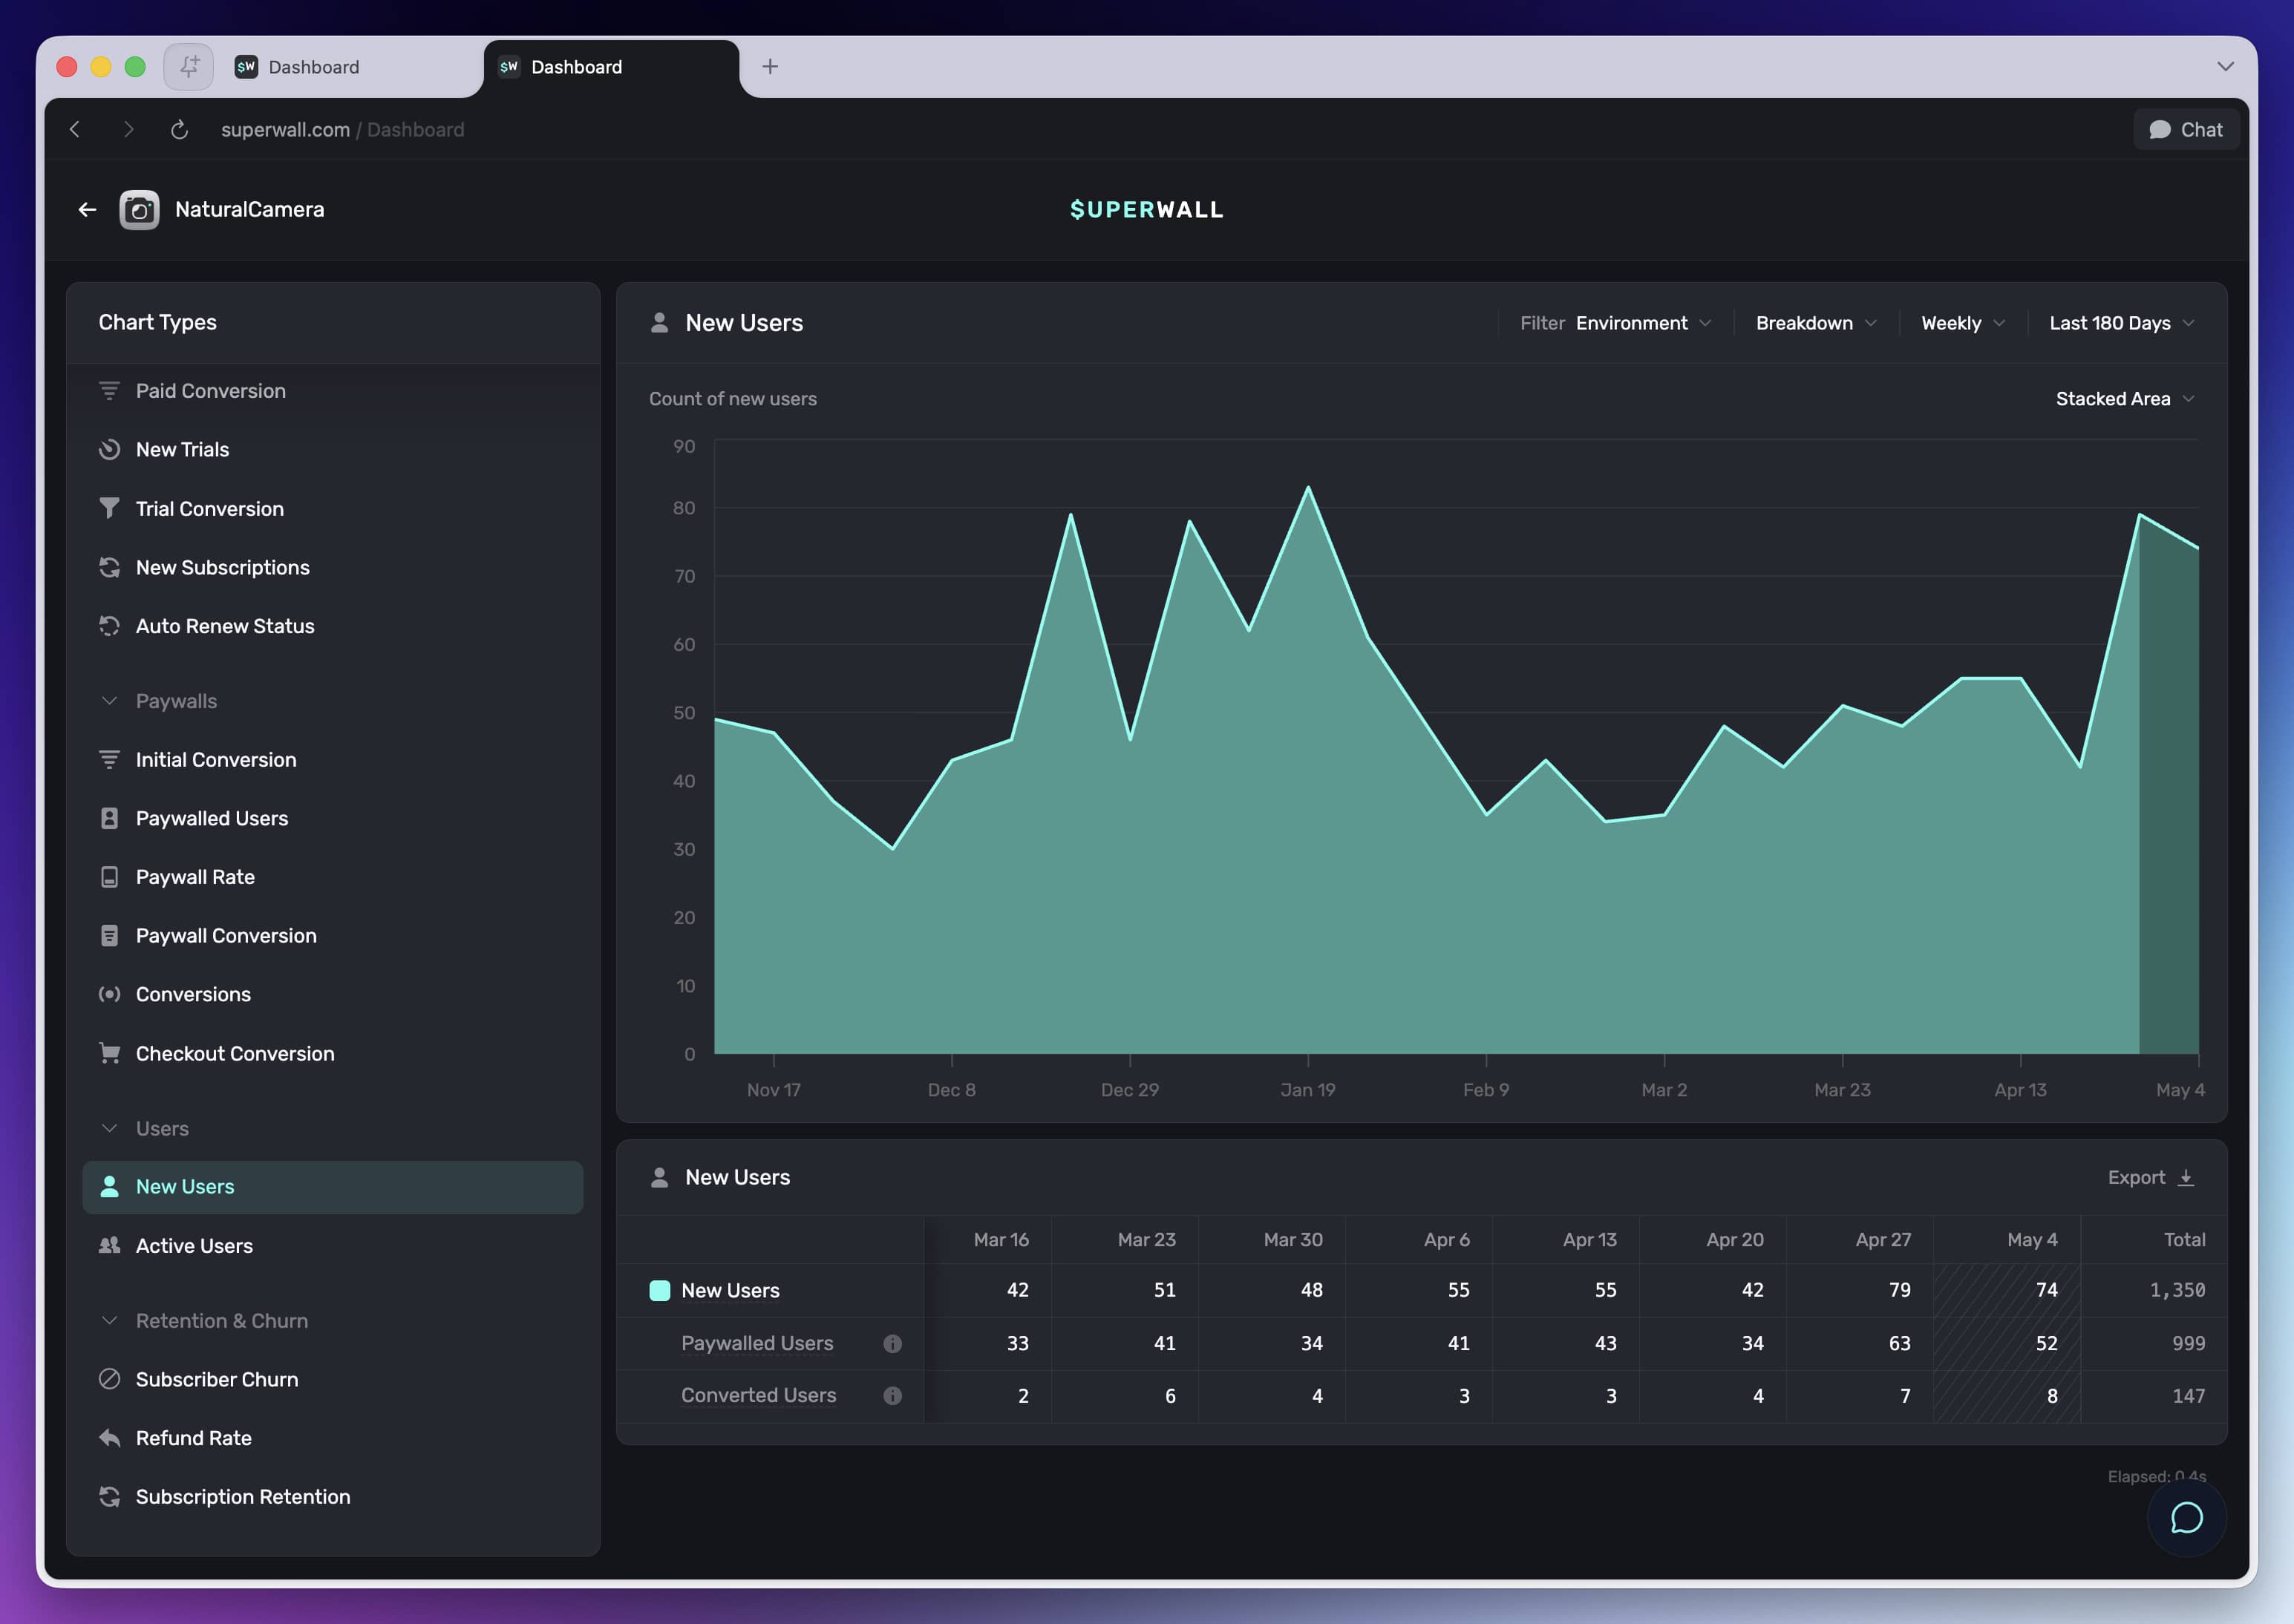
New Users shows the count of users who were first seen during each period.
How to use it
Use this chart to understand acquisition volume. It gives context for revenue, conversion, paywall exposure, and subscription metrics that may move because traffic changed.
Good to know
When conversion or revenue rates change, check New Users to see whether the app's audience mix or volume changed at the same time.
How is this guide?